Saltu al enhavo

Dosiero:1000 Year Temperature Comparison.png

Paĝenhavo ne ekzistas en aliaj lingvoj.
El Vikipedio, la libera enciklopedio

1000_Year_Temperature_Comparison.png((599 × 442 rastrumeroj, grandeco de dosiero: 32 KB, MIME-tipo: image/png))

Jen dosiero de la Wikimedia-Komunejo. La priskribo en ties priskriba paĝo estas montrata suben.
La Komunejo estas dosieruja retejo de libere licencitaj dosieroj.
Tiu ĉi bildo graph respektive ĉiuj bildoj en tiu ĉi artikolo aŭ kategorio prefere estu rekreata(j) kiel vektora grafikaĵo en la formato SVG. Vektoraj formatoj por grafikaĵoj havas multajn avantaĝojn, detaloj troveblas anglalingve en la komuneja artikolo Commons:Media for cleanup. Se vi havas aŭ kreas SVG-version de tiu ĉi bildo, bonvolu alŝuti ĝin al la vikipedia komunejo. Post tiu ago, ĉi tiu ŝablono en la bildpaĝo estas anstataŭigenda per la ŝablono {{vector version available|nova dosiera nomo.svg}}.

Resumo

Priskribo
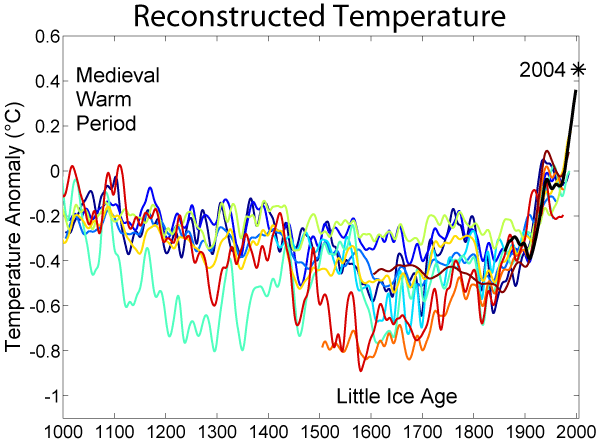
English: This image is a comparison of 10 different published reconstructions of mean temperature changes during the 2nd millennium. More recent reconstructions are plotted towards the front and in redder colors, older reconstructions appear towards the back and in bluer colors. An instrumental history of temperature is also shown in black. The medieval warm period and little ice age are labeled at roughly the times when they are historically believed to occur, though it is still disputed whether these were truly global or only regional events. The single, unsmoothed annual value for 2004 is also shown for comparison. (Image:Instrumental Temperature Record.png shows how 2004 relates to other recent years).

It is unknown which, if any, of these reconstructions is an accurate representation of climate history; however, these curves are a fair representation of the range of results appearing in the published scientific literature. Hence, it is likely that such reconstructions, accurate or not, will play a significant role in the ongoing discussions of global climate change and global warming.

For each reconstruction, the raw data has been decadally smoothed with a σ = 5 yr Gaussian weighted moving average. Also, each reconstruction was adjusted so that its mean matched the mean of the instrumental record during the period of overlap. The variance (i.e. the scale of fluctuations) was not adjusted (except in one case noted below).

Except as noted below, all original data for this comparison comes from here and links therein. It should also be noted that many reconstructions of past climate report substantial error bars, which are not represented on this figure.
Dato
Fonto http://www.globalwarmingart.com/wiki/File:1000_Year_Temperature_Comparison.png
Aŭtoro Robert A. Rohde
Ceteraj versioj

Reconstructions

The reconstructions used, in order from oldest to most recent publication are:

  1. (dark blue 1000-1991): The Holocene.
  2. (blue 1000-1980): Geophysical Research Letters.
  3. (light blue 1000-1965): Ambio. Modified as published in Science.
  4. (lightest blue 1402-1960): J. Geophys. Res..
  5. (light green 831-1992): Science.
  6. (yellow 200-1980): Geophysical Research Letters. doi:10.1029/2003GL017814.
  7. (orange 200-1995): Reviews of Geophysics. doi:10.1029/2003RG000143
  8. (red-orange 1500-1980): Geophys. Res Lett.. doi:10.1029/2004GL019781
  9. (red 1-1979): Nature. doi:10.1038/nature03265
  10. (dark red 1600-1990): Science. doi:10.1126/science.1107046

(black 1856-2004): Instrumental data was jointly compiled by the Climatic Research Unit and the UK Meteorological Office Hadley Centre. Global Annual Average data set TaveGL2v [1] was used.

Documentation for the most recent update of the CRU/Hadley instrumental data set appears in: Journal of Climate.

Permesiloj:

The original version of this figure was prepared by Robert A. Rohde from publicly available data and is incorporated into the Global Warming Art project.

Image from Global Warming Art
This image is an original work created for Global Warming Art. Please refer to the Year Temperature Comparison.png image description page for more information.
GNU head Estas permesite kopii, disdoni kaj/aŭ redakti ĉi tiun dokumenton, sen senŝanĝaj sekcioj, sen antaŭkovrilaj kaj sen dorskovrilaj tekstoj, laŭ la kondiĉoj de la Permesilo GNU por Liberaj Dokumentoj, Versio 1.2 aŭ ajna pli nova versio eldonita de la Free Software Foundation; sen Senŝanĝaj Sekcioj, Antaŭovrilaj Tekstoj aŭ Malantaŭkovrilaj Tekstoj. Kopio de la permesilo estas inkluzivita en la sekcio titolita GNU Free Documentation License.
w:eo:Creative Commons
atribuite samkondiĉe
Ĉi tiu dosiero estas disponebla laŭ la permesilo Krea Komunaĵo Atribuite-Samkondiĉe 3.0 Neadaptita.
Vi rajtas:
  • kunhavigi – kopii, distribui kaj publikigi la verkon
  • aliigi – modifi, adapti, kompletigi, transformi, uzi la tutan verkon aŭ ties partojn, memstare aŭ en aliaj verkoj
La verko rajtas esti kunhavigata nur:
  • atribuite – Vi devas atribui aŭtorecon, liveri ligilon al la permesilo kaj marki ĉu ŝanĝoj estis faritaj. Faru tion en aprobinda maniero, tamen ne sugestante, ke permesinto aprobas vin aŭ vian uzon.
  • samkondiĉe – Se vi rekombinas la verkon, transformas ĝin aŭ kreas devenaĵon bazitan sur ĝi, vi rajtas distribui la rezultan verkon nur laŭ la sama aŭ kongrua permesilo kompare kun ĉi tiu.
Ĉi tiu permesila etikedo estis aldonita al la dosiero kiel parto de la permesila aktualigo por GFDL.


Notes

  1. Data from Moberg et al. was taken directly from the supplemental information accompanying the Nature article.
  2. Data for Oerlemans was provided by William M. Connolley.
  3. Esper et al. reported only fluctuations in "arbitrary" units, so the variance in this record was rescaled to match the variance during the period of overlap with the instrumental record.
  4. When a paper included multiple reconstructions, the global annually average temperature data was used. If this was not reported, then Northern Hemisphere annually averaged data was used.
  5. Four records appearing at [2] were not used in preparing this graph for the following reasons:
    1. Mann et al. 98 was not included because Mann et al. 99 extended and updated that record.
    2. Briffa et al. 98 was not included because Briffa et al. 2001 extended and updated that record.
    3. Pollack et al. 98 was not included because the reported data was not found to be in a form that allowed for easy replotting.
    4. Mann et al. 2000 was not used because it did not include an original reconstruction covering at least the Northern Hemisphere.


Dragons flight's Temperature Record Series
This figure is part of a series of plots created by Dragons flight to illustrate
changes in Earth's temperature and climate across many different time scales.
Time Period: 25 yrs | 150 yrs | 1 kyr | 2 kyr | 12 kyr | 450 kyr | 5 Myr | 65 Myr | 500 Myr
For articles related to this topic see: Temperature record

Titoloj

Donu unulinian priskribon de la enhavo de ĉi tiu dosiero

Eroj prezentitaj en ĉi tiu dosiero

montras

image/png

896104465de636e551cb77de82d0892e1e892551

32 749 bajto

442 rastrumero

599 rastrumero

Dosierhistorio

Alklaku iun daton kaj horon por vidi kiel la dosiero tiam aspektis.

Dato/HoroBildetoGrandecojUzantoKomento
nun23:14, 21 nov. 2019Bildeto por versio ekde 23:14, 21 nov. 2019599 × 442 (32 KB)MyridiumSomebody updated the image with a "2016" label that isn't even included in the data analysed! Data analysed only goes up to 2004.
06:54, 5 maj. 2019Bildeto por versio ekde 06:54, 5 maj. 2019599 × 500 (48 KB)TobusUpdate to show 2016 temperature anomaly
17:10, 16 jul. 2014Bildeto por versio ekde 17:10, 16 jul. 2014599 × 442 (32 KB)JeffyPShrinkin' the image.
22:51, 17 dec. 2005Bildeto por versio ekde 22:51, 17 dec. 2005599 × 442 (40 KB)Saperaud~commonswiki*'''Description:''' [[en:Image:{{subst:PAGENAME}}]]

Neniu paĝo ligas al ĉi tiu dosiero.

Suma uzado de la dosiero

La jenaj aliaj vikioj utiligas ĉi tiun dosieron: