
Dosiero:Airflow-Obstructed-Duct.png
Bildo en pli alta difino ((1 270 × 907 rastrumeroj, grandeco de dosiero: 85 KB, MIME-tipo: image/png))
| Jen dosiero de la Wikimedia-Komunejo. La priskribo en ties priskriba paĝo estas montrata suben.
|
Resumo

|
File:N S Laminar.svg estas vektora versio de ĉi tiu bildo. Ĝi estu uzata anstataŭ ĉi tiu rastruma bildo, se ĝi ne estas malpli bonkvalita.
File:Airflow-Obstructed-Duct.png → File:N S Laminar.svg
Pliajn informojn vidu ĉe Help:SVG. |
 |
| Priskribo |
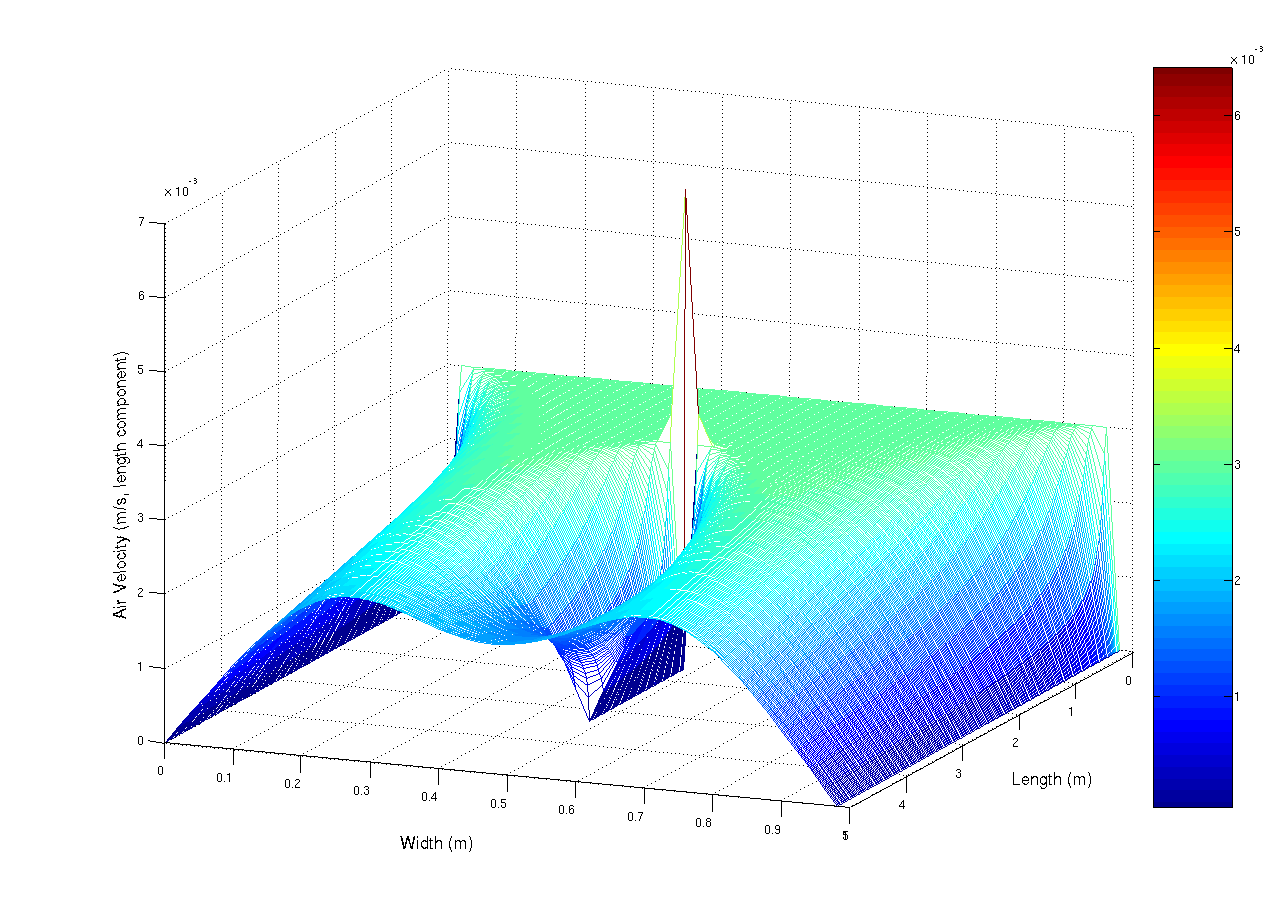
A simulation using the navier-stokes differential equations of the aiflow into a duct at 0.003 m/s (laminar flow). The duct has a small obstruction in the centre that is parallel with the duct walls. The observed spike is mainly due to numerical limitations. This script, which i originally wrote for scilab, but ported to matlab (porting is really really easy, mainly convert comments % -> // and change the fprintf and input statements) Matlab was used to generate the image.
%Matlab script to solve a laminar flow
%in a duct problem

%Constants
inVel = 0.003; % Inlet Velocity (m/s)
fluidVisc = 1e-5; % Fluid's Viscoisity (Pa.s)
fluidDen = 1.3; %Fluid's Density (kg/m^3)

MAX_RESID = 1e-5; %uhh. residual units, yeah...
deltaTime = 1.5; %seconds?
%Kinematic Viscosity
fluidKinVisc = fluidVisc/fluidDen;

%Problem dimensions
ductLen=5; %m
ductWidth=1; %m

%grid resolution
gridPerLen = 50; % m^(-1)
gridDelta = 1/gridPerLen;
XVec = 0:gridDelta:ductLen-gridDelta;
YVec = 0:gridDelta:ductWidth-gridDelta;

%Solution grid counts
gridXSize = ductLen*gridPerLen;
gridYSize = ductWidth*gridPerLen;

%Lay grid out with Y increasing down rows
%x decreasing down cols
%so subscripting becomes (y,x) (sorry)
velX= zeros(gridYSize,gridXSize);
velY= zeros(gridYSize,gridXSize);
newVelX= zeros(gridYSize,gridXSize);
newVelY= zeros(gridYSize,gridXSize);

%Set initial condition

for i =2:gridXSize-1
for j =2:gridYSize-1
velY(j,i)=0;
velX(j,i)=inVel;
end
end

%Set boundary condition on inlet
for i=2:gridYSize-1
velX(i,1)=inVel;
end

disp(velY(2:gridYSize-1,1));

%Arbitrarily set residual to prevent
%early loop termination
resid=1+MAX_RESID;

simTime=0;

while(deltaTime)
 count=0;
while(resid > MAX_RESID && count < 1e2)
 count = count +1;
for i=2:gridXSize-1
for j=2:gridYSize-1
newVelX(j,i) = velX(j,i) + deltaTime*( fluidKinVisc / (gridDelta.^2) * ...
(velX(j,i+1) + velX(j+1,i) - 4*velX(j,i) + velX(j-1,i) + ...
velX(j,i-1)) - 1/(2*gridDelta) *( velX(j,i) *(velX(j,i+1) - ...
velX(j,i-1)) + velY(j,i)*( velX(j+1,i) - velX(j,i+1))));

newVelY(j,i) = velY(j,i) + deltaTime*( fluidKinVisc / (gridDelta.^2) * ...
(velY(j,i+1) + velY(j+1,i) - 4*velY(j,i) + velY(j-1,i) + ...
velY(j,i-1)) - 1/(2*gridDelta) *( velY(j,i) *(velY(j,i+1) - ...
velY(j,i-1)) + velY(j,i)*( velY(j+1,i) - velY(j,i+1))));
end
end

%Copy the data into the front
for i=2:gridXSize - 1
for j = 2:gridYSize-1
velX(j,i) = newVelX(j,i);
velY(j,i) = newVelY(j,i);
end
end

%Set free boundary condition on inlet (dv_x/dx) = dv_y/dx = 0
for i=1:gridYSize
velX(i,gridXSize)=velX(i,gridXSize-1);
velY(i,gridXSize)=velY(i,gridXSize-1);

    end

    %y velocity generating vent
    for i=floor(2/6*gridXSize):floor(4/6*gridXSize)
        velX(floor(gridYSize/2),i) = 0;
        velY(floor(gridYSize/2),i-1) = 0;
    end

%calculate residual for
%conservation of mass
resid=0;
for i=2:gridXSize-1
for j=2:gridYSize-1
%mass continuity equation using central difference
%approx to differential
resid = resid + (velX(j,i+ 1)+velY(j+1,i) - ...
(velX(j,i-1) + velX(j-1,i)))^2;
end
end

resid = resid/(4*(gridDelta.^2))*1/(gridXSize*gridYSize);
fprintf('Time %5.3f \t log10Resid : %5.3f\n',simTime,log10(resid));


simTime = simTime + deltaTime;
end
mesh(XVec,YVec,velX)
deltaTime = input('\nnew delta time:');
end
%Plot the results
mesh(XVec,YVec,velX)
|
| Dato | la 24-a de februaro 2007 (origina alŝuta dato) |
| Fonto | Transigita de en.wikipedia al Commons. |
| Aŭtoro | User A1 de angla Vikipedio |
Permesiloj:
| Ĉi tiu verko estis liberigita kiel publika havaĵo de ties aŭtoro, User A1 de angla Vikipedio. Tio aplikatas tutmonde. En iuj landoj tio povas esti laŭleĝe neebla; en tiu okazo: User A1 donas al iu ajn la rajton uzi ĉi tiun verkon por iu ajn uzo, sen kondiĉoj, krom se tiuj kondiĉoj deviĝas per leĝo. |
Originala alŝutada protokolo
- 2007-02-24 05:45 User A1 1270×907×8 (86796 bytes) A simulation using the navier-stokes differential equations of the aiflow into a duct at 0.003 m/s (laminar flow). The duct has a small obstruction in the centre that is paralell with the duct walls. The observed spike is mainly due to numerical limitatio
Dosierhistorio
Alklaku iun daton kaj horon por vidi kiel la dosiero tiam aspektis.
| Dato/Horo | Bildeto | Grandecoj | Uzanto | Komento | |
|---|---|---|---|---|---|
| nun | 15:52, 1 maj. 2007 | | 1 270 × 907 (85 KB) | Smeira | {{Information |Description=A simulation using the navier-stokes differential equations of the aiflow into a duct at 0.003 m/s (laminar flow). The duct has a small obstruction in the centre that is paralell with the duct walls. The observed spike is mainly |
Dosiera uzado
La jena paĝo ligas al ĉi tiu dosiero:
Suma uzado de la dosiero
La jenaj aliaj vikioj utiligas ĉi tiun dosieron:
- Uzado en anp.wikipedia.org
- Uzado en ar.wikipedia.org
- Uzado en ba.wikipedia.org
- Uzado en bg.wikipedia.org
- Uzado en bn.wikipedia.org
- Uzado en ca.wikipedia.org
- Uzado en ckb.wikipedia.org
- Uzado en cs.wikipedia.org
- Uzado en de.wikipedia.org
- Uzado en en.wikipedia.org
- Uzado en en.wikiquote.org
- Uzado en es.wikipedia.org
- Uzado en fa.wikipedia.org
- Uzado en he.wikipedia.org
- Uzado en hif.wikipedia.org
- Uzado en hi.wikipedia.org
- Uzado en hr.wikipedia.org
- Uzado en hy.wikipedia.org
- Uzado en id.wikipedia.org
- Uzado en jv.wikipedia.org
- Uzado en ko.wikipedia.org
- Uzado en ko.wikiversity.org
- Uzado en map-bms.wikipedia.org
- Uzado en ms.wikipedia.org
- Uzado en mwl.wikipedia.org
- Uzado en pt.wikipedia.org
- Isaac Newton
- Equação diferencial
- Equações de Navier-Stokes
- Equação diferencial linear
- Equação diferencial de Bernoulli
- Equação diferencial de d'Alembert
- Decaimento exponencial
- Equação de Laplace
- Equação diferencial parcial
- Equação de Poisson
- Equação do calor
- Lema de Grönwall
- Teorema de Picard-Lindelöf
- Método de Runge-Kutta
- Equação de Mason-Weaver
- Equação do pêndulo
Vidi plian ĝeneralan uzadon de ĉi tiu dosiero.